11 Temmuz 2012 Çarşamba
10 Temmuz 2012 Salı
9 Temmuz 2012 Pazartesi
Read Text From the Raw Content in Resource Folder.
Sample Code-----------public class MainActivity extends Activity {
private Spanned mText = null; private TextView mTextView; public void onCreate(Bundle savedInstanceState) { super.onCreate(savedInstanceState); setContentView(R.layout.main); mTextView = (TextView) findViewById(R.id.sampleText); if (mText == null) { String text = readTextResource(R.raw.license, this); mText = Html.fromHtml(text); } mTextView.setText(mText); } public String readTextResource(int resourceId, Activity owner) { StringBuffer strBuffer = new StringBuffer(); InputStream inputStream = null; try { inputStream = owner.getResources().openRawResource(resourceId); BufferedReader br = new BufferedReader(new InputStreamReader(inputStream)); String str = br.readLine(); while (str != null) { strBuffer.append(str); str = br.readLine(); } } catch (IOException e) { } finally { try { if (inputStream != null) { inputStream.close(); } } catch (IOException e) { } } return strBuffer.toString(); } }
How to Obfuscated Android Code
The following steps to describe the android obfuscation
1) Setup the obfuscated environment Download the follwing file before you starts
ProGuard
ProGuard is a free Java class file shrinker, optimizer, obfuscator, and preverifier. It detects and removes unused classes, fields, methods, and attributes. It optimizes bytecode and removes unused instructions. It renames the remaining classes, fields, and methods using short meaningless names. Finally, it preverifies the processed code for Java 6 or for Java Micro Edition.
Download From Sourceforge : http://sourceforge.net/
Reference : http://proguard.sourceforge.
Download files from internet
- add-proguard-release.xml
- procfg.txt
1) To update an existing Android project, open a command-line and navigate to the tools/ directory of your SDK. Now run:
android update project --name
2) So, now you have a signed build from the command line, but still no obfuscated build.
To make things easy, you’re going to want to get two helper files:
add-proguard-release.xml and procfg.txt
Copy these files into your root directory (where the build.xml file found).
3) To add Proguard to your build, you first need to edit your local properties file to add the location of the directory that Proguard is installed in:
proguard.dir=/Directory/
3) Finally... you need to add our script to your build file and have it override a few targets. To do this, we use the XML “entity” construct. At the top of your build.xml file, add an entity that references our script file:
]
>
4) By default ADT creates a proguard.cfg file with every new project, so if you have an existing project just copy it over from a new dummy project. The next step is to enable ProGuard, you do this by adding the following to your default.properties file:
proguard.config=proguard.cfg
(assuming proguard.cfg is the ProGuard configuration file created for you, or copied from a new project, into the project root folder.)
Scrollable Text View in andriod
This article helps to making Scrollable TextView in Android.
We can do it two ways. 1.Create a TextView inside the ScrollView and 2. TextView with dispatch Events.
Create a TextView inside the ScrollView< ScrollView android:layout_width="fill_parent" android:layout_height="wrap_content" android:fillViewport="true"> < LinearLayout android:layout_width="fill_parent" android:layout_height="fill_parent"> < TextView android:text="@+id/TextView01" android:id="@+id/mTextView" android:layout_width="fill_parent" android:layout_height="fill_parent">< / TextView>
< / LinearLayout>< / ScrollView>
Activity ImplementationmTextView = (TextView) findViewById(R.id.logTextView);mTextView .setText("");mTextView .setMovementMethod(ScrollingMovementMethod.getInstance());
Scrollable Text View in andriod -2
This article helps to making Scrollable TextView using TextView with dispatchKeyEvent
we can make a scrollable textview while implement the setMovementMethod and dispatchKeyEvent.
1. private TextView mTextView;
2. Set the Required data in the TextView mTextView = (TextView) findViewById(R.id.textView1); mTextView.setText("this is for testing \nthis is for testing \nthis is for testing \nthis is for testing \nthis is for testing \nthis is for testing \n");
3. mTextView.setMovementMethod(new ScrollingMovementMethod(){.....})
4. Override the methods in ScrollingMovementMethod
new ScrollingMovementMethod() { public void onTakeFocus(TextView widget, Spannable text, int dir) {} @Override public boolean onKeyDown(TextView widget, Spannable buffer, int keyCode, KeyEvent event) { switch (keyCode) { case KeyEvent.KEYCODE_DPAD_DOWN: for (int i = 0, scrollAmount = getScrollAmount(widget); i < scrollAmount; i++) { down(widget, buffer); } return true; case KeyEvent.KEYCODE_DPAD_UP: for (int i = 0, scrollAmount = getScrollAmount(widget); i < scrollAmount; i++) { up(widget, buffer); } return true; default: return super.onKeyDown(widget, buffer, keyCode, event); } }
private int getScrollAmount(TextView widget) { final int visibleLineCount = (int) ((1f * widget.getHeight()) / widget .getLineHeight()); int scrollAmount = visibleLineCount - 1; if (scrollAmount < 1) { scrollAmount = 1; } return scrollAmount; } }
5. Call the dispatch method in your code mTextView.dispatchKeyEvent(event);
SAMPLE
public class MainActivity extends Activity { /** Called when the activity is first created. */
private TextView mTextView;
@Override public void onCreate(Bundle savedInstanceState) { super.onCreate(savedInstanceState); setContentView(R.layout.main); mTextView = (TextView) findViewById(R.id.textView1); mTextView .setText("this is for testing \nthis is for testing \nthis is for testing \nthis is for testing \nthis is for testing \nthis is for testing \n");
mTextView.setMovementMethod(new ScrollingMovementMethod() { public void onTakeFocus(TextView widget, Spannable text, int dir) {
}
@Override public boolean onKeyDown(TextView widget, Spannable buffer, int keyCode, KeyEvent event) { switch (keyCode) { case KeyEvent.KEYCODE_DPAD_DOWN: for (int i = 0, scrollAmount = getScrollAmount(widget); i < scrollAmount; i++) { down(widget, buffer); } return true; case KeyEvent.KEYCODE_DPAD_UP: for (int i = 0, scrollAmount = getScrollAmount(widget); i < scrollAmount; i++) { up(widget, buffer); } return true; default: return super.onKeyDown(widget, buffer, keyCode, event); } } private int getScrollAmount(TextView widget) { final int visibleLineCount = (int) ((1f * widget.getHeight()) / widget .getLineHeight()); int scrollAmount = visibleLineCount - 1; if (scrollAmount < 1) { scrollAmount = 1; } return scrollAmount; } }); } @Override public boolean onKeyDown(int keyCode, KeyEvent event) { switch (keyCode) { case KeyEvent.KEYCODE_DPAD_DOWN:
return true; case KeyEvent.KEYCODE_DPAD_UP: mTextView.dispatchKeyEvent(event); return true; default: return super.onKeyDown(keyCode, event); } }}
Combine two images in android java
In this blog we are combine two images and we have two images stored locally on an SD card or drawble folder in android.
Steps:
Read the image from Source InputStream istream = context.getResources().openRawResource(R.drawable.img1); try { image1 = BitmapFactory.decodeStream(istream); istream = context.getResources().openRawResource(R.drawable.img2); image2 = BitmapFactory.decodeStream(istream); } finally { try { istream.close(); } catch (IOException e) { } }
Define the Image property int width = 0, height = 0; if (c.getWidth() > s.getWidth()) { width = c.getWidth(); height = c.getHeight() + s.getHeight(); } else { width = s.getWidth(); height = c.getHeight() + s.getHeight(); }
Create your target Bitmap, Bitmap combinedImages = Bitmap.createBitmap(width * 2, height, Bitmap.Config.ARGB_8888);
Create a Canvas for it, Canvas comboImage = new Canvas(combinedImages); Use Canvas.drawBitmap to blit each source bitmap into your target bitmap comboImage.drawBitmap(image1, 0f, 0f, null); comboImage.drawBitmap(image2, 0f, image1.getHeight()+1, null);
Example: public Bitmap combineImages(Context context, int img1, int img2) { // Bitmap[] mBitmap = new Bitmap[6]; Bitmap image1, image2;
InputStream istream = context.getResources().openRawResource(img1); try { image1 = BitmapFactory.decodeStream(istream); istream = context.getResources().openRawResource(img2); image2 = BitmapFactory.decodeStream(istream); } finally { try { istream.close(); } catch (IOException e) { } } int width = 0, height = 0; if (c.getWidth() > s.getWidth()) { width = c.getWidth(); height = c.getHeight() + s.getHeight(); } else { width = s.getWidth(); height = c.getHeight() + s.getHeight(); } Bitmap combinedImages = null; combinedImages = Bitmap .createBitmap(width * 2, height, Bitmap.Config.ARGB_8888); Canvas comboImage = new Canvas(combinedImages); comboImage.drawBitmap(c, 0f, 0f, null); comboImage.drawBitmap(s, 0f, c.getHeight()+1, null); return cs; }
8 Temmuz 2012 Pazar
Transit Tweets on Google Maps

Transid's RER Tweet Map is a heat map of over 4,000 Tweets in Paris that mention the RER (Paris' rapid transit system).
The map uses the new HeatMap layer in the Google Maps API. This visualisation of the Tweets quickly reveals that (maybe unsurprisingly) that many people mention RER when they are at a station or when on a train.
The map includes a number of options that allow you to adjust the display of the HeatMap layer on the map. The Google Maps API gives developer options to adjust the radius of data points, the opacity of the layer and the colors used. Transid's RER Tweet Map has created buttons to allow the users to change these elements themselves to adjust how the heat map displays on the map.


Own Virtual Property on Google Maps

Geopieces is a new location and event sharing application.
After you log-in to Geopieces with your Facebook account you can share your location with your friends by adding a marker to the Geopieces Google Map. As well as sharing your location you can use Geopieces to add events to the map, write a blog entry at a location, or leave tips and reviews about venues.
Geopieces users can also add their photos and videos to the map and even add website links to venues on the map.
When you first log-in to Geopieces you are also given 5,000 Geocredits. You can use your Geocredits to own part of the Geopieces map. Users can develop their Geopieces on the map and can even earn more Geocredits if other users visit or add markers to their Geopiece.
Your Mapper Adds Heat Maps

Your Mapper has added some exciting new features to it's mapped data visualisation application.
Your Mapper provides an easy to use application that allows users to create and visualise data on a Google Map and embed the created map in a website or blog. Your Mapper has used the new HeatMaps layer in the Google Maps API to add a new option to view data as a heat map on a Google Map (for example the screenshot above shows a heat map of greenhouse gas emissions in the USA).
One really cool feature of Your Mapper is that you can visualise data added by other users. So using the links in the map sidebar you can view heat maps for lots of different data sets, from the density of nursing homes to the locations of catholic churches in the USA.
Your Mapper has also added a number of other interesting features such as the option to view a transit layer, a global cloud coverage layer and has also implemented a new muted map style which helps to emphasise the data added to the map.
Map Channels Version 4.08 Update

Map Channels, the popular Google Maps creation tool, has released a number of new features in its latest update.
Map Channels allows users to create a map with data held in a KML file, a Google Spreadsheet, a GeoRSS feed, tab delimited text or a Google Fusion Table. Map Channels also allows users to add data manually with the 'Edit' feature.
Version 4.8 of Map Channels includes some new features such as the ability to add a transit and weather layer to a created map. Users can also now add links in the header of their maps that show near-by events and near-by hotels.
The latest update to Map Channels also adds a few more customisation options for users and also gives the user the option to locally host a map or to embed it in their own website or blog. A full list of all the new features and improvements in version 4.8 is available on the Map Channels home page.
The Google Maps of the Week

AXS Map is using the Google Maps API to crowd-source and review accessible buildings and venues.
You can search AXS Map for accessible venues by searching for a type of venue and a location, e.g. restaurants in New York or coffee in San Francisco. The results of each search are then displayed on a Google Map. Venues that have already been reviewed for their accessibility are displayed on the map with a green map marker.
If you click on a reviewed venue you can find out if the building has a wide entry and if it has ramped access. You can also discover whether the restrooms are accessible. As AXS Map is a crowd-sourced platform users can also contribute their own reviews of a venue's accessibility.

Bostonography is running a project to find out where Bostonians believe their neighborhood boundaries lie.
The project is using a Google Maps tool which allows participants to draw on a Google Map where they think Boston neighborhood boundaries run. This has allowed Bostonography to create a map of all the amalgamated responses so far.
The results for each neighborhood are also being analysed to see which neighborhood boundaries participants have a strong agreement about and to highlight areas where there are contradictory opinions about which neighborhood they belong to.
7 Temmuz 2012 Cumartesi
Towards Crowdsourcing Forest Monitoring: lessons from SAD powered by Google Earth Engine
Editor's note: Throughout this week we'll be publishing a series of blog posts about our activities at Rio+20, the United Nations Conference on Sustainable Development. This guest post is from Google Earth Engine partner Carlos Souza of Imazon.
In the last seven years Brazil has reduced deforestation considerably, and forest monitoring has been a key part of this effort. Imazon, a Brazilian NGO working to promote sustainable development in the Amazon, has developed a forest monitoring system called SAD, and has been working with Google to integrate Google Earth Engine into our work. We’re now ready to share our progress and to take the next step in our efforts to crowdsource forest monitoring in Brazil and, potentially, the rest of the world.
First a bit about Imazon and our work. SAD is an acronym, in Portuguese, for Sistema de Alerta de Desmatamento, or Deforestation Alert System. This system detects and measures deforestation and forest degradation in Brazil by analyzing MODIS satellite imagery. The idea is to track deforestation in the same way the government tracks inflation, making it a regularly updated indicator of the overall health of the country.
SAD analysis is quite complex, involving a great deal of satellite data. The end result of the analysis is a ratio of soil, photosynthetic vegetation, and non-photosyntheic vegetation for each pixel in a MODIS image covering the Brazilian Amazon. SAD tracks and reports deforestation and forest degradation on a monthly basis by calculating changes in this ratio for satellite images acquired at different times. We provide this map, along with deforestation alerts, to key authorities working to fight illegal deforestation in the Amazon.
This past weekend at Google’s “From the Ground to the Cloud” event at Rio+20 we proudly announced the next step in the evolution of SAD: SAD-EE, powered by Google Earth Engine. Starting in July, Imazon's monthly deforestation reports -- which includes deforestation happening while we are here at Rio+20 -- will be generated by SAD-EE.
SAD-EE improves Imazon’s forest monitoring program in several ways:
- We can now access and process the data using Google’s cloud, which dramatically changes how we work. For instance, during the testing phase of using SAD-EE we reduced the amount of time we spend downloading and managing the very large data sets of MODIS images by 50%, and analysis in the cloud is much faster than on our desktop computers. Getting this information to the authorities faster can be translated into several hectares of forests saved each month
- SAD-EE is integrated with the Internet, mobile phone and computer tablet technologies, making it easier for local organizations to access it.
- The system can be used outside Brazil, allowing other tropical forest countries to monitor their forests. Indeed, there is now a project to make this happen through a partnership with Google and the World Resources Institute, via the Global Forest Watch Program.
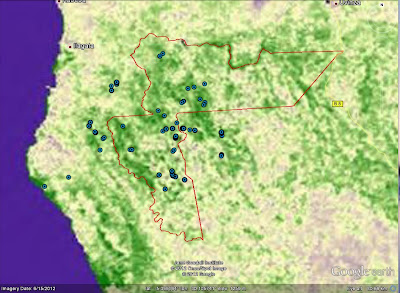
For me, the most exciting aspect of SAD-EE is that the system demonstrates the potential for Google Earth Engine to become a multi-sensor, multi-algorithm, multi-technology, crowdsourcing environmental monitoring platform. As Google Earth Engine evolves, it is allowing scientists and remote sensing users to share their knowledge and tools and enabling large groups of people to track and report changes in our planet.
SAD-EE's reporting tool


Where the roads aren't - and why it matters
Editor's note: Last week we published a series of blog posts about our activities at Rio+20, the United Nations Conference on Sustainable Development. The post below is by Rebecca Moore, manager of the Google Earth Outreach team.
We were excited to unveil at the Rio+20 Conference the initial fruits of a unique collaboration with a member of the European Parliament and the Society for Conservation Biology: a global, interactive map of the world’s “Roadless Areas.”
The project came about when we were approached by MEP Kriton Arsenis, the European Parliament's Rapporteur on forests. He explained that, while most people using Google Maps want to know which roads will get them from point A to point B, the same information is useful for conservationists who want to know where roads aren’t. In his words:
The concept of "roadless areas" is a well-established conservation measure coming from conservation biologists from all around the globe. The idea is that roads in most parts of the world lead to the unmanageable private access to the natural resources of an area, most often leading to ecosystem degradation and without the consent of the local and indigenous communities. Keeping an area roadless means that the specific territory is shielded against such exogenous pressures, thus sustaining its ecosystem services at the maximum possible level. An important tool which will drive environmental, development as well as global climate change policy forward will be the Google development of an interactive satellite map of the world's roadless areas.We were intrigued by Kriton’s idea, so we decided to give it a try.
Start with where the Roads are
We started by taking all the road data (plus rail and navigable waterways) in Google Maps today, and importing that into our Google Earth Engine platform for analysis. For example, here is what the road network in Australia looks like when zoomed out to country-scale:

Then figure out where the roads aren't
Based upon advice from Kriton Arsenis and his project collaborators in the Society for Conservation Biology, we decided to define a “Roadless Area” (for the purposes of this prototype map) as any area of land more than ten kilometers from the nearest road. Using the global-scale spatial-analytic capabilities of Google Earth Engine, we then generated this raster map, such that every pixel in the map is color-coded based on distance from the nearest road. Every pixel colored green is at least 10km from the nearest road, and therefore considered part of a Roadless Area. For example:

Or consider the island of Madagascar, home to some of the most unique species on Earth:

From these maps it becomes more apparent how the simple construction of new roads can fragment and disturb habitats, potentially driving threatened species closer to extinction.
Finally we decided to try running this “Roadless Area” algorithm at global-scale:

Large roadless areas are readily apparent such as the Amazon and Indonesian rainforests, Canadian boreal forest and Sahara desert.
Caveats and Next Steps
The road data used to produce these maps inevitably contains inaccuracies and omissions. The good news is that Google already has a tool, Google Map Maker, that can be used by anyone to submit new or corrected map data, and in fact this tool is already being used in partnership with the United Nations to support global emergency response. We look forward to continued development of this prototype, which can help to turn the abstract concept of “Roadless Areas” into something quite concrete and, we hope, useful to policymakers, scientists and communities around the world. To explore these Roadless Area maps yourself, visit the Google Earth Engine Map Gallery.
Posted by Rebecca Moore, Manager, Google Earth Outreach and Google Earth Engine


Geo in Rio: Cool Tools for a Warming Planet
Editor's note: Last week we published a series of blog posts on the Google Green Blog about our activities at Rio+20, the United Nations Conference on Sustainable Development. This is our final post in the series - thanks for reading along!
The week we spent at Rio+20 incredibly productive and rewarding. We marveled at the natural beauty of our surroundings, we took hundreds of visitors to our booth for a wild ride on the Liquid Galaxy, and we met with some of the world’s leading experts on sustainable development.
Several of those experts participated in our official Side Event, titled “Tools for Mobile Data Collection: From the Ground to the Cloud” on Monday, June 18th. We’ve been using the “ground to the cloud” phrase a lot these days. It was coined by Vasco van Roosmalen of ECAM, who helped the Surui tribe of the Brazilian Amazon get certification to enter the carbon credit market.
The idea is that data can be collected offline -- using, for instance, Android smartphones and open-source software called Open Data Kit (ODK) -- and then, back in an online environment, uploaded to Google cloud services (like Google Maps Engine) to display in a map. The Surui use this method to collect ground data for their carbon offsets project, and if you download the recently launched Surui Cultural Map you can see exactly where they collected their data. The Surui expect to avoid the emission of 6 million tons of carbon over the 30 years by avoiding the deforestation of 40 thousand hectares of forests and protecting an additional 200,000 hectares.
Two other participants at our event, Fundação Amazonas Sustentável (FAS) and The Jane Goodall Institute demonstrated the importance of community participation in keeping trees standing. FAS is using Open Data Kit to monitor and manage the forest reserves in Juma, Rio Madeira Reserve and in Rio Negro in the Brazilian Amazon. Dr. Lilian Pintea, with Timothy Akugizibwe, Sood Ndimuligo and other Jane Goodall Institute staff, trained over 100 Village Forest Monitors in Tanzania and Uganda to take part in protecting their forest. They’ve also mapped chimpanzee distribution alongside biomass models from Dr. Alessandro Baccini of Woods Hole Research Center (see credits in photo caption).
This is very exciting because it has never been done before. Now, stakeholders in Tanzania and elsewhere can substantially cut their hardware, software and data storage and management costs. They can now fully focus fully on comparing the biomass model with what’s actually on the ground, and develop maps and statistics that better meets decision-makers' information needs. The new biomass map of western Tanzania shows the amount of biological material (and carbon) in the region, and could be an important predictor for modeling potential distribution of chimpanzees in the region.
 |
 |
| From Rio+20 |
“What is the use of living, if it be not to strive for noble causes and to make this muddled world a better place for those who will live in it after we are gone?”Posted by Tanya Birch, Google Earth Outreach Team

Go offline with Google Maps for Android
Having an Internet connection has always been a key requirement for using Google Maps for Android... until now.
A few weeks ago we told you that offline Google Maps for Android was coming. Now, you can download the latest version of the app in Google Play, then select and save a region of a map from more than 150 countries for use offline. Whether travelling internationally, carrying a WiFi-only device, heading underground on the subway or restricting your mobile data usage, you can now save up to six large metro areas (e.g., Greater London, Paris, or New York City and surrounding area) and use Google Maps for Android to find your way.
Let’s say you find yourself traveling to London this summer. Before you head off on your trip, simply find the area that you’ll be visiting. Then select “Make available offline” from the menu and verify the area that you would like to save.
Below the map, you’ll see we estimate the file size for you, so you know how much space it will take on your device. Once you confirm your selection the map will immediately start downloading.
 |
| Save an area and go to My Places to see all your offline maps |
So whether you’re traveling internationally or underground, we hope offline maps will help you get around.
Today we’re also releasing a smoother and faster Compass Mode for Street View within Google Maps for Android. It’s the next best thing to being there, because your device becomes a window into a 360-degree, panoramic view of the outdoor or interior location through Business Photos. To experience the improved qualities of this feature you need a device with Google Maps for Android, Android 3.0 or higher and a gyroscope sensor plus version 1.8.1 of Street View on Google Maps.
 | |
|
Posted by Jiabei Lei, Software Engineer, Google Maps Mobile

Take flight through new 3D cities on Google Earth for Android
Explorers of the world, rejoice! There is now a new way to explore the world, right from the palm of your hand. Gone are the days when the only way to get a bird’s eye, 3D view of your favorite metropolitan area was from the window of a penthouse apartment or helicopter. Now you can soar above your favorite cities in 3D, with Google Earth for mobile.
New 3D Imagery
We recently shared a preview of this striking new 3D imagery and starting today, you can take flight yourself with our latest version of Google Earth for Android. An updated version of Google Earth for iOS will be also be available soon.

Creating this comprehensive 3D experience is possible due to advanced image processing. Using 45-degree aerial imagery, we're able to automatically recreate entire metropolitan areas in 3D. This means every building (not just the famous landmarks), the terrain, and any surrounding landscape of trees are included to provide a much more accurate and realistic experience.
Get started today by taking a virtual flight over one of our initial 3D imagery cities: Boulder, Boston, Santa Cruz, San Diego, Los Angeles, Long Beach, San Antonio, Charlotte, Tucson, Lawrence, Portland, Tampa, Rome or the San Francisco Bay Area (including the Peninsula and East Bay). We’ll continue to release new 3D imagery for places around the world over the coming months; by the end of the year, we aim to have new 3D coverage for metropolitan areas with a combined population of 300 million people.
Tour Guide
Not sure where to begin? Let the new tour guide help show you the way. We’ve put together short tours of thousands of famous places and historical sites across the globe so it’s easier than ever to discover amazing places. Just pull up the tab at the bottom of the screen to open the tour guide. Each image highlights a tours or place of interest in the area you are looking. Click on an item and you will be flown there. As you fly in and around the sites, snippets from Wikipedia provide additional information about the location. It’s like having a local expert right beside you!

We hope this more accurate, comprehensive and realistic 3D representation of the Earth brings out the inner explorer in you. Whether you are visiting familiar grounds or venturing out into the world, Google Earth is there to show you the way.

5 Temmuz 2012 Perşembe
Take a virtual tour with the swipe of your finger
This week we announced new 3D imagery on Google Earth for Android for a select number of initial cities, including San Francisco, Los Angeles and Rome. Along with the availability of more comprehensive and realistic 3D imagery, we’ve also included a new tour guide feature in this latest release. Taking a virtual trip to places such as Stonehenge in England, Brandenburg Gate in Germany, or the Great Wall of China has always been possible by typing a location into Google Earth; but how do you know where in the world you’d like to visit if you are not familiar with an area?
The new tour guide allows you to discover and explore interesting places around the world, even if you didn’t know to search for them. It is already available on Google Earth for Android, and an update to Google Earth for iOS will be coming soon. We invite you to embark on any of the more than 11,000 tours of popular sites in over 110 countries and regions, from famous landmarks to scenic treasures. You can open the tour guide with a quick swipe of the tab located on the bottom of the main Google Earth screen.

Thumbnails of available pre-created tours will dynamically update with interesting locations in your current view. Simply click the thumbnail image to start the tour and begin your online adventure of discovering new and exciting places around the world.
Where available, the tours include 3D models for the most realistic experience possible. Information from Wikipedia also provides more information on famous sites, so you can learn more about the places that interest you as your virtually fly over them. The tour guide also includes user-contributed Picasa and Panoramio photos as thumbnails for a preview of the featured location.
To get started, update Google Earth on your mobile device. Happy touring!

U.S. Wildfires: New Google Crisis Map, Colorado imagery and more
To help provide relevant information related to the wildfires spreading through Colorado and Utah, the Google Crisis Response team has assembled a new crisis map for the 2012 U.S. wildfire season. The map features fire perimeters from the U.S. Geological Survey, Red Cross shelters in affected areas and new satellite imagery provided by DigitalGlobe, of the Waldo Canyon Fire near Colorado Springs. You can also see more authoritative, local-level data from sources including the State of Colorado Division of Emergency Management and the Utah Division of Emergency Management.
U.S. Wildfires map showing the perimeter of the fire near Colorado Springs. View larger map.
Use the checkboxes along the right-hand panel to turn on and off the layers of information, and the “Share” button at the top of the map to grab the URL or embed code. Note that both the URL and the embed code will automatically restore your current view of the map, including the set of layers that you have turned on.
New satellite imagery captured by DigitalGlobe on Thursday. View larger map.
You can also view the updated imagery in Google Earth to better understand the situation on the ground and its effects on these communities — just download this KML file. It includes both the optical and near-infrared images of the Waldo Canyon Fire, taken Thursday June 28.
Stay tuned for more map updates as we identify additional information for the wildfires. If you have data that you’d like to see included on the Google Crisis Map, contact us using this form and we’ll take a look.
Google Crisis Response Team
